Search This Blog

Thursday 27 April 2017

Confidence Interval

A range of values that we fairly sure the true value lies in. In statistical inference, to estimate the population parameters used the observed sample data.

Confidence interval also known as estimated range of values which include as unknown population parameter and the estimated range calculated from set of sample data (taken from Valerie J. Easton and John H. McColl's).

The confidence interval formula is

X  ±  Z
s
√(n)
Where:
·         X is the mean
·         Z is the Z-value from the table below
·         s is the standard deviation
·         n is the number of samples


Z
80%
1.282
85%
1.440
90%
1.645
95%
1.960
99%
2.576
99.5%
2.807
99.9%
3.291


Calculating the confidence interval

Step 1:
Note down all the number in the data, calculate the mean and standard deviation for the samples.

·         Number of samples: n = 40
·         Mean: X = 175
·         Standard Deviation: s = 20

Step 2:
Decide the confidence interval that we want. There are 90%, 95% and 99%. Then, find the value of "Z" for the confidence interval and let's say we choose 95%, the value of Z value is 1.960


Z
80%
1.282
85%
1.440
90%
1.645
95%
1.960
99%
2.576
99.5%
2.807
99.9%
3.291

Step 3:
Insert the Z value into the formula and we have

175 ± 1.960 ×
20
√40

The result is 
175cm ± 6.20cm
In conclusion, the data lies between 168.8cm to 181.2cm
By: Nur Fariza

References:
Definition taken from Valerie J. Easton and John H. McColl's Statistics Glossary v1.1)
http://www.stat.yale.edu/Courses/1997-98/101/confint.htm


Tuesday 25 April 2017

Sample Size, Power and Effect Size

What is sample size?

Sample size is when your sample size is increases, it is power of your test. This should make sense because the more you collected information, the larger sample of means for your data which makes it easy to reject the null hypothesis when you should. You have to conduct a power analysis to ensure that your sample size is big enough.

For any power calculation, you need to know
  1. What type of test you going to use either independent t-test, ANOVA and others.
  2. The alpha value that you are using. For example, 0.01 or 0.05.
  3. The expected effect size itself.
  4. The sample size that going to use.
After the values are already chosen, a power value between 0 and 1 will be generated. If the power less than 0.8, you have to increase your sample size.

What is power?

Power is when you conduct a inferential statistics test, it help to understand what is power. if you are comparing two hypotheses the null and alternative hypothesis. The inferential statistics looks for evidence that you can reject the null or alternative to conclude that you studies had an effect or not. With any statistical test, there always have a possibility to find a difference between group when one does not exist. This is known as Type I error but for Type II error it possible when difference does exist which the test not able to identify.

Power also refers to the probability that your test need to find statistically significant difference when such a difference actually exists. Power is probability you to reject the null hypothesis when you should and accept that the power is greater 0.8

What alpha value that need to use to calculate power?

An alpha level is less than 0.5, it showed a statistically significant and the most common alpha level used in evalutions


What is effect size?

When a difference is significant, it does not necessarily that mean is big. It simply means you that you data had a difference. For example, that you evaluate the effect of activity on student knowledge using pre-test and post-tests. The mean score for the pre-test was 83 out of 100 while the mean score on the post-test was 84 out of 100. Although you find that the difference in scores is statistically significant because of a large sample size, the difference is very slight, suggesting that the program did not lead to a meaningful increase in student knowledge.


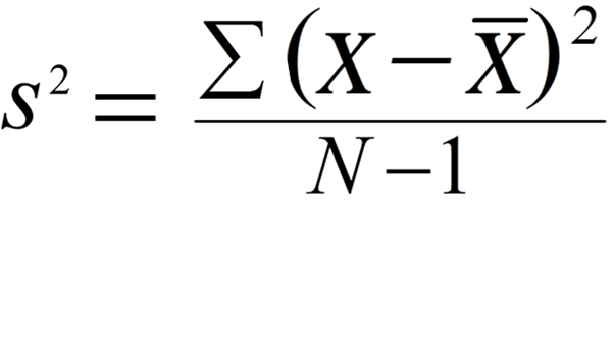
How to calculate the effect size?


There are different ways to calculate the effect size depending on the evaluation that you use. Generally, effect size is calculated by taking the difference between the two groups such as the mean of treatment group "minus" the mean of the control group and "dividing" it by the standard deviation of one of the groups. For example, in an evaluation with a treatment group and control group, effect size is the difference in means between the two groups divided by the standard deviation of the control group.

To interpret the resulting number, most social scientists use this general guide developed by Cohen:
·         < 0.1      = trivial effect
·         0.1 - 0.3 = small effect
·         0.3 - 0.5 = moderate effect
·         > 0.5      = large difference effect


By: Nur Fariza


References:


Friday 21 April 2017

Variability


Variance
  • Position of each observation relative to the mean of the set.
  • Measures the amount of spread or variability of observation from mean
  • Useful statistic in certain high level of statistical procedure


standard deviation
  • a measure of how spread out numbers are
  • Square root of variance
  • Widely used and better measure of variability
  • Smaller value of standard deviation, the closer to the mean
  • Sensitive to extreme value
Range
  • difference between the lowest and highest values
  • Tends to increase with sample size
  • Sensitive to very extreme values


By : Fatin Farhana binti Marzuki


References
Retrieved on April 21, 
    2017 https://www.mathsisfun.com/data/standard-deviation-
    formulas.html
Retrieved on April 21, 
    2017 http://www.sciencebuddies.org/science-
    fairprojects/project_data_analysis_variance_       
    std_deviation.shtml
Retrieved on April 21, 
    2017 https://www.mathsisfun.com/data/range.html

Wednesday 19 April 2017

Checking Missing Values

Missing values is when your data set contain some missing values where there will be participants did not answer some items in the questionnaire or did not complete the trial in an experiment.

1. When you enter the data, leave the missing values as a blank cells


2. Go to SPSS and fill all the empty cells by click "Transform and Recode into same variable".

3. Move all the variables into the "Numeric Variables" and click on "Old and New Values".


4. On the left select "System-or-user-missing" and at the right "New Values" enter the number will not otherwise occur in the data. Click "Add" and "Continue". Click on "OK".


5. All the blank cells will replaced with the value that you entered in previous step.


6. After the step, SPSS will not include these number in any calculations you must complete one final step. Click on "Variable View".

7. At the eighth column, click on "Missing" at the first cell under the column. Click on the blue box that appears in the cell.


8. Select the "Discrete Missing Values" and enter in the box the number you choose like previous step 4. Click "OK".


9. Repeat back step 7 and step 8 for every row in the variable view in your data. You also can copy and paste into all cells below.


Conclusion : If you computing the data please consider the impact of missing values. it might be more suitable to calculate the mean instead based on number of the participants. Alternatively, some questionnaire will be manuals advise replacing missing values with the participants mean score before calculating the total.


By: Nur Fariza

References:

- Book
Pallant, J. (2013). SPSS survival manual: A step by step guide to data analysis using SPSS (5th ed.) Maidenhead: Open University Press/ McGraw-Hill.

- Website
https://www.spss-tutorials.com/spss-missing-values-tutorial/
http://stats.idre.ucla.edu/spss/modules/missing-data/
https://www.ibm.com/support/knowledgecenter/pl/SSLVMB_22.0.0/com.ibm.spss.statistics.help/spss/mva/idh_miss.htm

Outlier


Values that are very small or very large relative to the majority of the values in a data set


Outlier in histogram

Outlier in scatter plot

Outlier in boxplot

Variables that are sensitive to extreme value
  1. Mean
  2. Variance
  3. Standard deviation
  4. Range
Variables that are not sensitive to extreme value
  1. Median
  2. Mode

By : Fatin Farhana binti Marzuki

References :
Retrieved on April 19, 2017 www.itl.nist.gov/div898/handbook/prc/section1/prc16.html


Type I and Type II Errors

Errors in hypothesis
-Divided into 2 types of errors:
  -Type I error (α).
  -Type II error (β).

Type I error (α)
-The probability of the null hypothesis being rejected when it is true.
-It is incorrect rejection of the null hypothesis (Ho).

 Type II error (β)
-The probability of the null hypothesis to fail to be rejected when it is false.
-It is the incorrect acceptance of the null hypothesis (Ho).


Should the null hypothesis (Ho) is rejected when is it false, the decision will be correct (1-β).


By: Pengiran Hazieq Izzat

References
Websites
http://www.statisticshowto.com/type-i-and-type-ii-errors-definition-examples/
https://www.ma.utexas.edu/users/mks/statmistakes/errortypes.html
http://support.minitab.com/en-us/minitab/17/topic-library/basic-statistics-and-graphs/hypothesis-tests/basics/type-i-and-type-ii-error/

Hypothesis testing

Hypothesis
-An educated guess based on published result or preliminary observations regarding the study.
-It is also an assumption on the parameter of the population.
2 types of hypothesis
-Null hypothesis (Ho)
  -The accepted facts of the study.
  -It is the hypothesis that is to be tested.
  -Hypothesis where there is no difference.
-Alternative hypothesis (HA)
  -The hypothesis suggests there is a difference.

Hypothesis testing
-Example;
  -Ho:  There is no difference in sports performance between male and female football players.
  -HA: The sports performance of male football players are better compared to female football                         players.
-Hypothesis testing procedures:
  1. Generate the null hypothesis and alternative hypothesis.
  2. Set the significance level (α).
  3. Check the assumption.
  4. Compute the test statistics and associate the result with the p value.
  5. Interpret the result.
  6. Conclude.


By. Pengiran Hazieq Izzat

References
Websites
http://stattrek.com/hypothesis-test/hypothesis-testing.aspx
http://www.statisticshowto.com/probability-and-statistics/hypothesis-testing/